Linear Regression and Gradient Decent method to learn model of Linear Regression.
Linear Regression
To design Machine learning Model following steps are important
1. Collection of
data
2. Cleaning of
Data
3. Divide data into Training
and Testing
4.
Model Building
1. Training of Network
2. Testing of Network
5. Validation of Neural
Network
For
model building Choice of Algorithm is very important. Machine learning models are used
either for Regression (to predict the continuous value) or classification(divide data into group)
Table shows use of particular machine learning algorithm
|
Algorithm |
Use |
|
Ø Linear
Regression |
Regression |
|
Ø Logistic
Regression |
Classification |
|
Ø Naïve Bayes |
Classification |
|
Ø K-Nearest
Neighbors |
Classification |
|
Ø Decision Tree |
Classification,
Regression |
|
Ø Random Forest |
Classification,
Regression |
|
Ø Support Vector Machine |
Classification,
Regression |
|
Ø ANN |
Classification,
Regression |
|
Ø Deep Learning |
Classification,
Regression |
Linear
regression: Machine Learning Algorithm
Variables
in Linear regression
Independent
variable
Ø If X is input numerical variable then X is called the independent variable or predictor.It is input of the model. All Features /Co-variant are independent variable
Dependent
Variable
Ø If Y is output numerical variable. Y is also called the dependent variable or response variable. It Output
of a model
Machine learning models are built to derive the relationship between the dependent variable and independent variable.
It predicts a continuous
dependent variable based on values of the independent variable in case of Linear Regression
Ø Linear regression
is Supervised Learning. It predicts Relationship between dependent and an independent variable which is linear
Ø E.g Income*Expenditure,
Chocolate* Cost, CGPA* placement package etc.
Ø The output
is a function to predict the dependent variable on the basis of the values of
independent variables
Ø A straight
line is used to fit the data

Linear regression is a simple approach to supervised learning.In the table, AREA is the independent variable and cost of flat is the dependent variable

Linear Relation –In a graph stress test is the independent variable and blood pressure is the dependent variable. The graph shows their is a linear relationship between dependent and Independent variable
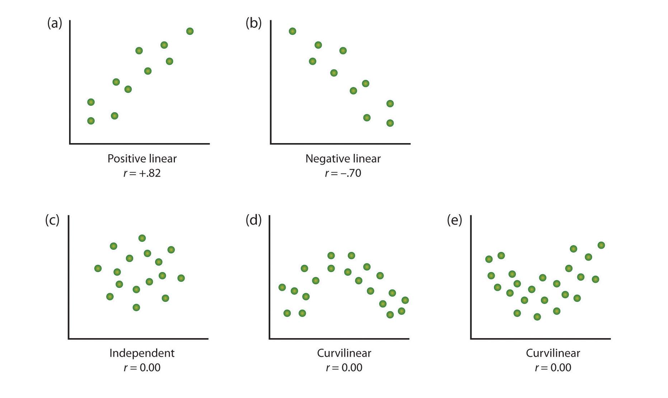
Correlation
▪X
and Y can exist in three different types of relations

They can also exist in a weak
relation –

Correlation –
Ø Correlation
is a statistical technique that predicts whether and how strongly pairs of
variables are related.
Ø The main
result of a correlation is called the correlation coefficient (or
"r"). It ranges from -1.0 to +1.0. The closer r is to +1 or -1, the
more closely the two variables are related.
Ø If r is
close to 0, it means there is no relationship between the variables
Ø If r is
positive, it means that as one variable gets larger the other gets larger
Ø If r is
negative, it means that as one gets larger the other gets smaller (often called
an "inverse")
Correlation –
Equation of Linear Regression –
Let paired data points (x1,
y1), (x2, y2), . .
, (xn yn),
Y = β0 + β1 * X
β0 ,
β1 are the coefficient
X Independent variable
Y Dependent variable
Types of Linear Regression –
Ø Linear
Regression
Y
= β0 + β1 * X
Ø If two or
more explanatory variables have a linear relationship with the dependent
variable, the regression is called a Multiple Linear Regression
Y = β0 + β1 * X +β2 * X2+ β3 *
X3+……+ βm * Xm
Example of Multiple Linear
Regression –
Ø Weather
Forecasting
Ø Water
demand of city (population, economy, water losses and water restrictions)
Ø Healthcare
(Malaria Prediction)
Optimize the value of the
coefficient by iteratively. Minimize error of the model on the data
1) Start with
random value of each coeffiient
2) Sum of
squared error is calculated for each pair of input and output values
3) Learning
rate is used as a scaler factor
4) Coefficient
are in the direction updated towards
minimizing error
5) Process is
repeated until minimum squared error is achieved and further improvement
Summary –
Ø To
predict a continuous dependent variable based on value of independent variable
Ø Dependent
variable is always continuous
Ø Least
square
Ø Y= β0+ β1 *
X --Straight line: Best fit curve
Ø Linear
relation between I and D
Ø Predicted
output
Ø Business prediction


Comments
Post a Comment